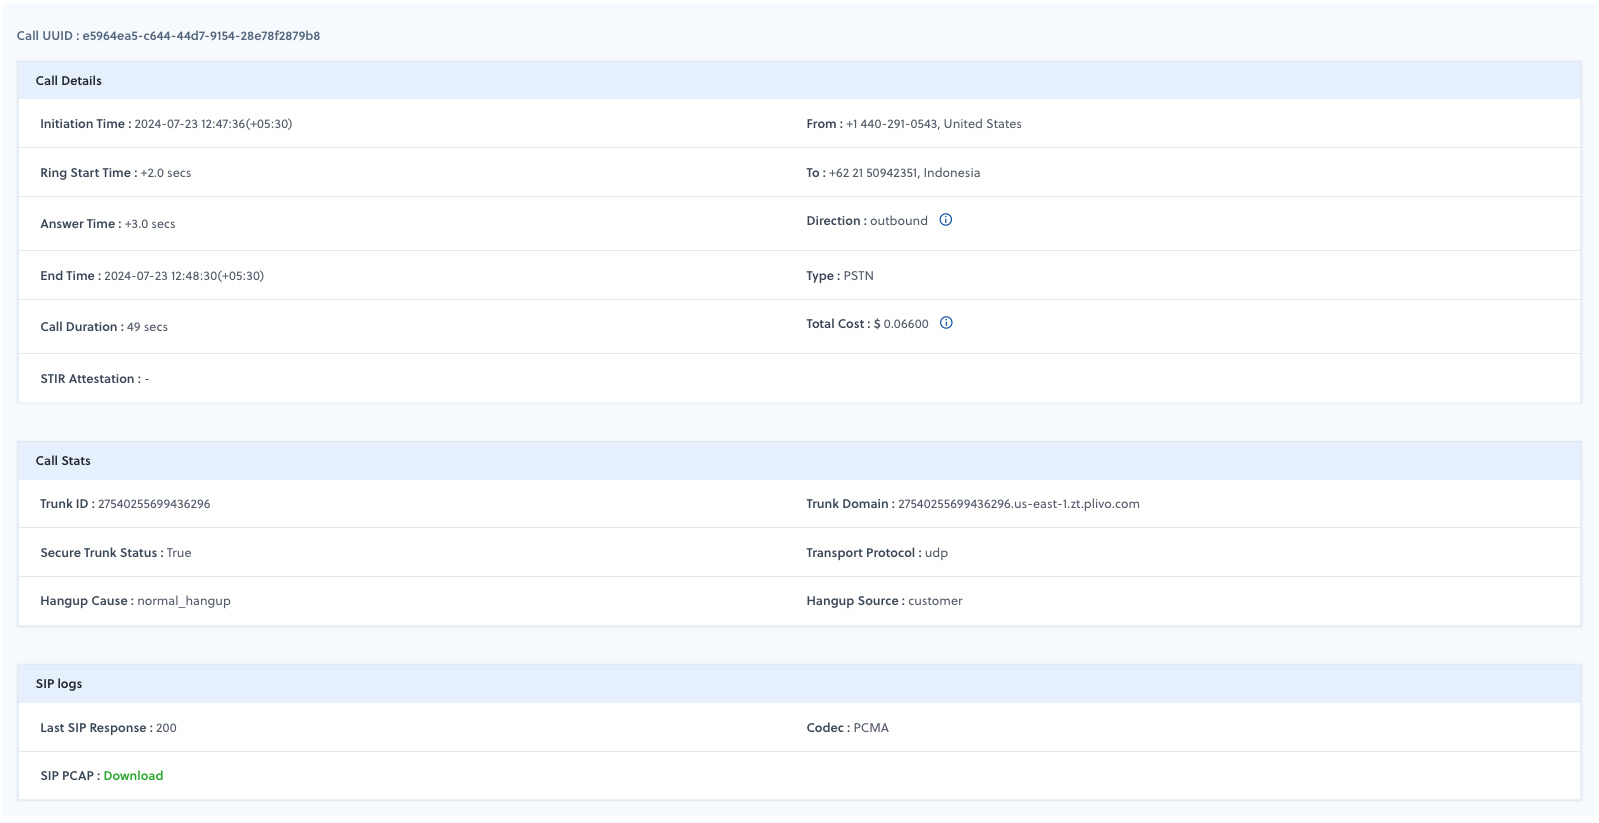
In the rapidly evolving landscape of cloud communication, ensuring smooth and reliable call connectivity stands paramount for businesses leveraging Plivo's communication solutions. Recognizing this critical need, we're thrilled to introduce SIP Trunking Debug Logs, a robust tool meticulously crafted to enhance your troubleshooting capabilities and streamline the process of diagnosing and resolving call connectivity issues.
Understanding SIP Trunking Debug Logs
SIP Trunking Debug Logs is an advanced feature designed to provide Plivo customers with deep insights and detailed logs for effective debugging of call connectivity challenges. This tool is part of our ongoing commitment to empower users with the resources they need to maintain seamless communication channels, thus ensuring uninterrupted business operations.
When to Use SIP Trunking Debug Logs
SIP Trunking Debug Logs become indispensable when facing call connectivity issues, such as calls not connecting, dropped calls, or poor call quality. These situations could stem from a multitude of factors ranging from network configurations, SIP signaling problems, to codec mismatches. Identifying the root cause quickly is critical to minimizing downtime and maintaining high standards of communication.
Key Features of SIP Trunking Debug Logs
- Call Details: This feature presents essential information about each call, including caller and call recipient details, timestamps, and call duration. It serves as the first step in understanding the context and flow of affected communications, allowing users to quickly pinpoint potential issues.
- Call Stats: Dive into origination, termination, and trunk-related details. This data is invaluable for identifying performance trends, anomalies, or bottlenecks that might be impacting the quality of your calls.
- SIP Logs: A cornerstone feature of SIP Trunking Debug Logs, the SIP Logs section enables the download of SIP PCAP files, showcasing the last SIP response and Codec information. This in-depth analysis of SIP signaling data is key to uncovering the root cause of connectivity issues, facilitating swift and effective resolution.

Call Details

Call stats

SIP Logs

How to Access and Utilize SIP Trunking Debug Logs
Accessing SIP Trunking Debug Logs is straightforward:
- Log into your Plivo console.
- Navigate to "SIP Trunking" and select "Logs" from the menu.
Here, you'll find an intuitive interface that displays all the necessary tools and information at your fingertips. For a more effective troubleshooting process, start by reviewing the Call Details to get a sense of the communication flow. Next, analyze the Call Stats to detect any patterns or anomalies. Finally, delve into the SIP Logs for a technical deep dive to identify the specific issue.
Leveraging SIP Trunking Debug Logs for Success
To get the most out of SIP Trunking Debug Logs, we recommend incorporating it into your regular troubleshooting and maintenance routines. By proactively reviewing and analyzing your call data, you're positioned to quickly identify and resolve issues, minimizing their potential impact on your communication workflows.
SIP Trunking Debug Logs are more than just a diagnostic tool; they're a means to ensure that your communication infrastructure is robust, reliable, and capable of supporting your business needs. We invite you to explore this feature and discover how it can enhance your Plivo experience.
If you have any feedback or require assistance, our support team is here to help. Happy debugging!


