Quick Start
Set Up an Application in Plivo Console
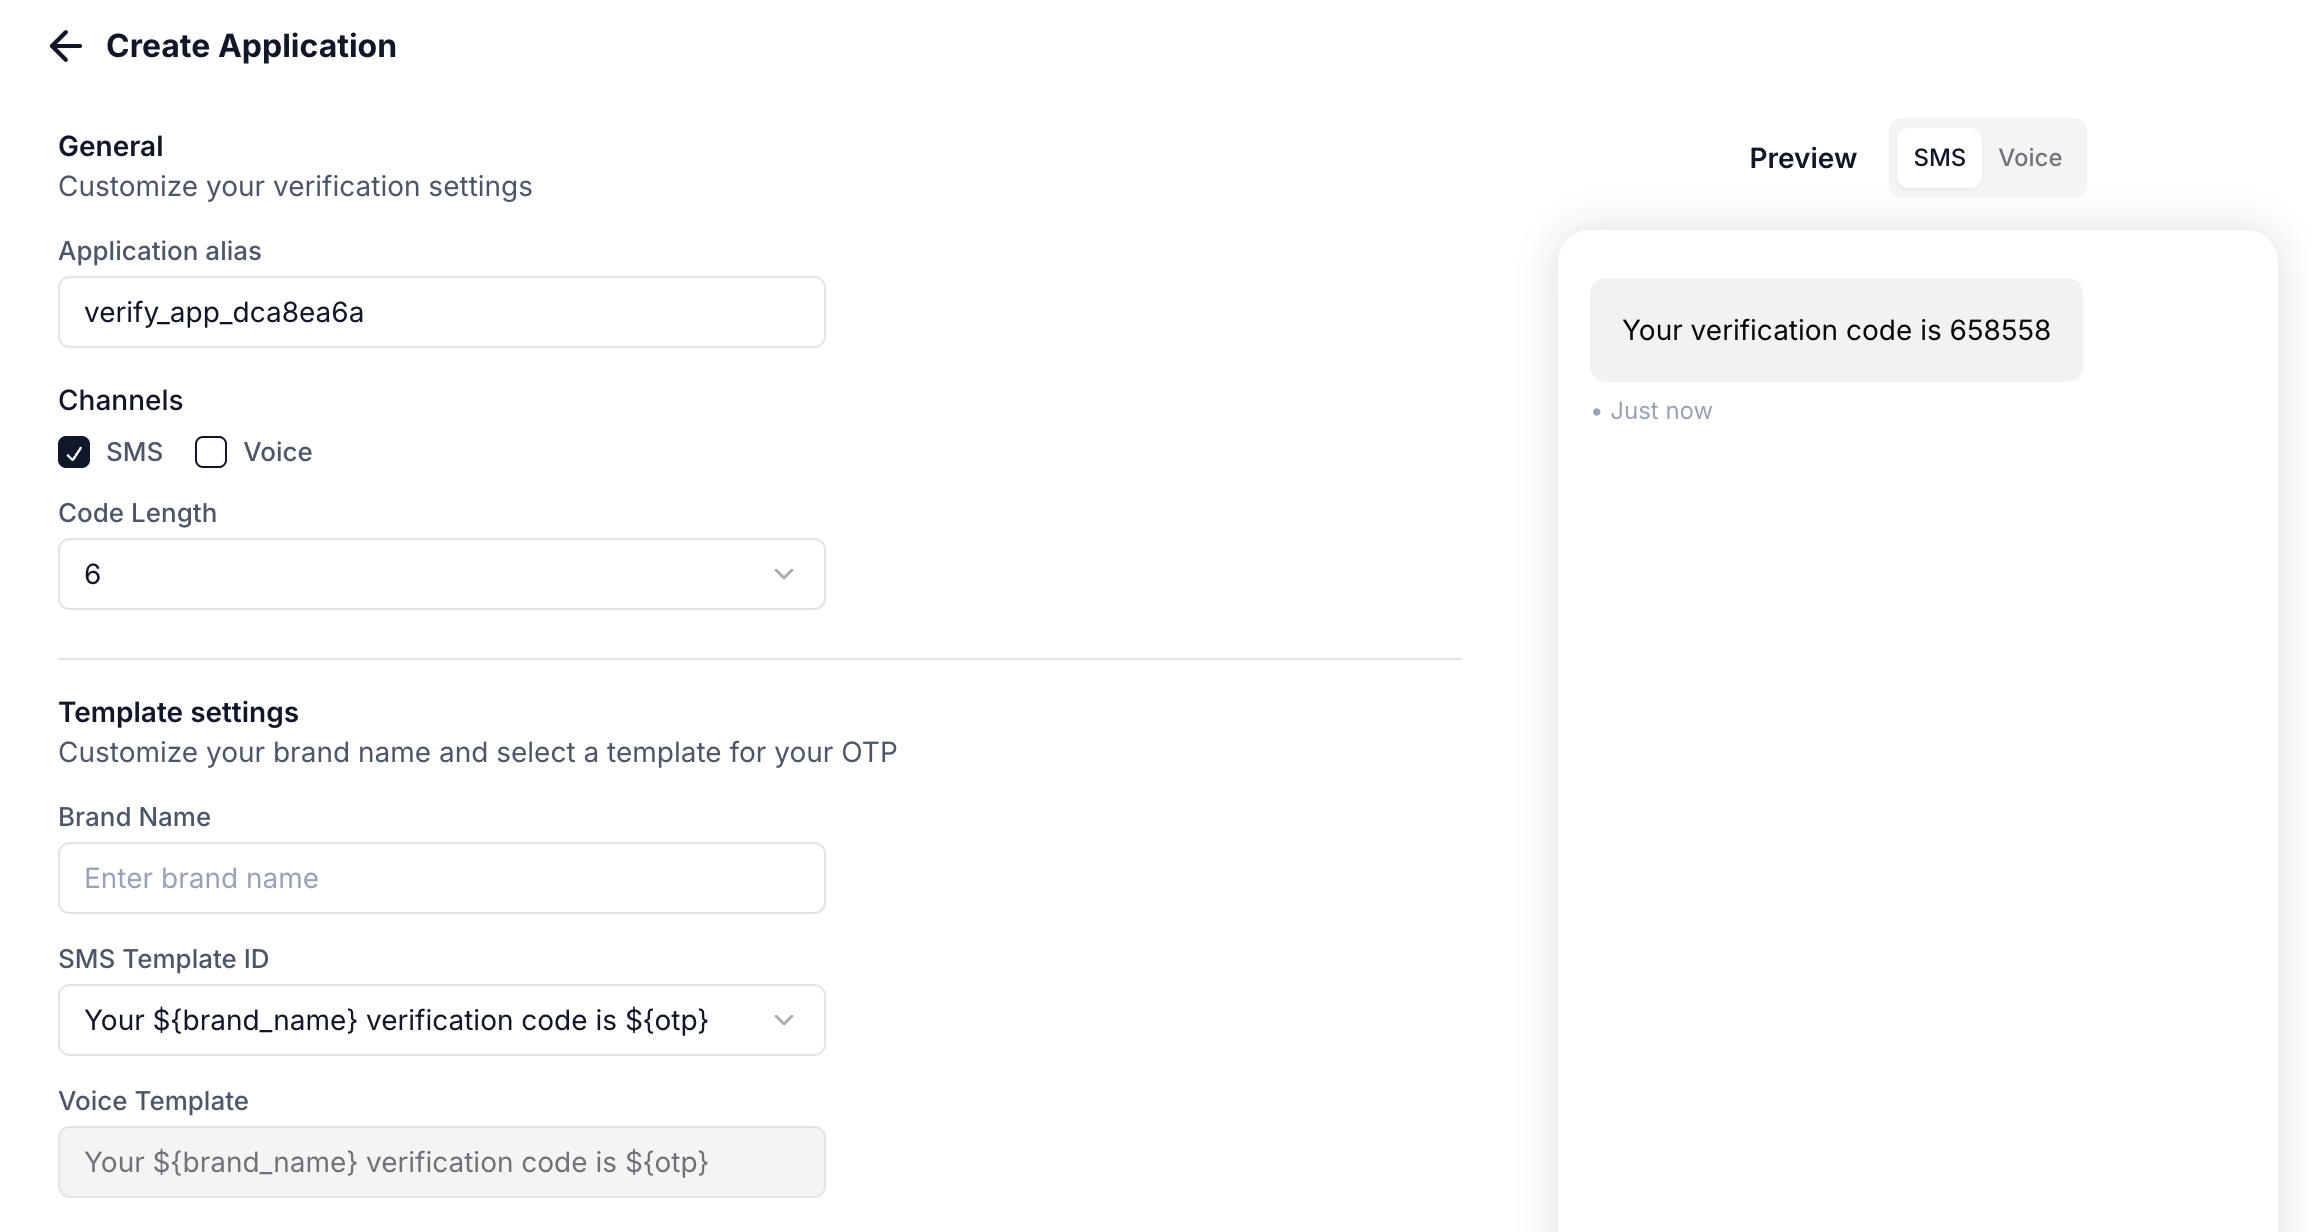
To start sending OTPs, create a Verify application in the Plivo Console.Configure these settings:
Once created, you’ll receive an Application UUID to use in API requests.
| Setting | Description |
|---|---|
| Alias | Friendly name for your application |
| Brand name | Your brand name shown in messages |
| Code length | Number of digits in the OTP (4-8) |
| Expiry | Time window before the OTP expires |
| Attempts | Maximum delivery attempts per session |
| Template | Message template (e.g., Your ${brand} verification code is ${code}) |
| Android AppHash | Hash string for automatic SMS verification on Android |

Create a Session to Send OTPs
Use the Create Session API to send an OTP:Set a callback URL to receive real-time delivery status updates.
Validate the OTP
When the user enters the OTP, validate it using the Validate Session API:
Channels: SMS vs Voice
The Verify API supports two delivery channels:| Channel | When to Use |
|---|---|
| SMS | Default choice. Fast, familiar, works on all phones. |
| Voice | Users without SMS capability, accessibility needs, or as fallback when SMS fails. |
Using Voice OTP
To send OTP via voice call, setchannel to voice:
Channel Fallback Strategy
For critical verifications, implement fallback:Sessions
A session represents a single verification interaction with a user. Each session can have multiple delivery attempts. Example: You send an OTP at 10:00 AM with a 10-minute expiry. This creates a session that expires at 10:10 AM. All delivery attempts during this window are part of the same session and deliver the same OTP.Session Lifecycle
- Created - OTP generated and first delivery attempted
- In Progress - Waiting for user to enter OTP (additional attempts possible)
- Verified - User entered correct OTP
- Expired - Session timed out without successful validation
Fraud Shield
Fraud Shield protects your applications from SMS pumping attacks by monitoring traffic in real-time and blocking suspicious messages.Protection Levels
| Level | Description |
|---|---|
| High | Strongest filtering, best for high-risk scenarios. May have more false positives |
| Medium | Balanced filtering (default). Fewer false positives |
| Low | Minimal filtering for apps with higher fraud tolerance |
Preventing False Positives
- Skip fraud check for trusted users - Set
check_fs=falsefor known good users - Create separate apps - Use different apps for Sign Up, Sign In, and Password Reset
- Use a dedicated low-protection app - For trusted user segments, create an app with Fraud Shield set to Low or Disabled
Signature Validation
Validate that webhook requests originate from Plivo using signature verification.HTTP Headers
All Plivo requests include:X-Plivo-Signature-V2- Generated using account/subaccount Auth TokenX-Plivo-Signature-Ma-V2- Always generated using main account Auth TokenX-Plivo-Signature-V2-Nonce- Unique nonce for the request
Generating the Signature
Calculate HMAC with:- Key: Your Plivo Auth Token
- Message: Base URI + X-Plivo-Signature-V2-Nonce (e.g.,
https://yourdomain.com/callback/05429567804466091622) - Hash function: SHA256
Example
Translation Support
Send verification messages in your users’ preferred languages.- Contact Plivo support to configure translations for your SMS templates
- Pass the
localeparameter when creating a session
Locale Format
Combine language code (ISO 639-1) and optional region code (ISO 3166-1):en- Englishen_US- English (US)es- Spanishfr_FR- French (France)
en) is used.
When to Use Multiple Applications
Most businesses need just one Verify application. Consider multiple applications when:- Different OTP lengths are needed (e.g., 4-digit for login, 6-digit for checkout)
- Different channels are required (SMS-only for logins, SMS+voice for payments)
- Different Fraud Shield settings are needed per use case
Reporting
View and analyze your verification traffic on the Plivo console at Verify > Logs.Session Logs
| Field | Description |
|---|---|
| Date | When the session was created |
| UUID | Unique session identifier |
| Application Alias | Name of the application used |
| Recipient | Destination phone number |
| Status | in-progress, verified, or expired |
| Attempts | Number of delivery attempts |
| Country | Destination country |
| Total Charge | Session cost including channel fees |
Filters
Filter results by subaccount, date range, status, country, phone number, or application alias.Session data is retained for 90 days.
Related
- Session API Reference - Full API documentation
- API Overview - Authentication and request format